|
| | t |
| 14 |
| 13 |
| 12 |
| 11 |
| 10 |
| 9 |
| 8 |
| 7 |
| 6 |
| 5 |
| 4 |
| 3 |
| 2 |
| 1 |
| 0 |
|
| H |
| 25,81 |
| 21,05 |
| 17,76 |
| 15,06 |
| 12,74 |
| 10,72 |
| 8,94 |
| 7,35 |
| 5,94 |
| 4,66 |
| 3,52 |
| 2,50 |
| 1,57 |
| 0,74 |
| 0,00 |
|
| H1 |
| 1,066 |
| 0,984 |
| 0,904 |
| 0,824 |
| 0,745 |
| 0,667 |
| 0,589 |
| 0,513 |
| 0,437 |
| 0,363 |
| 0,288 |
| 0,215 |
| 0,143 |
| 0,071 |
| 0,000 |
|
|
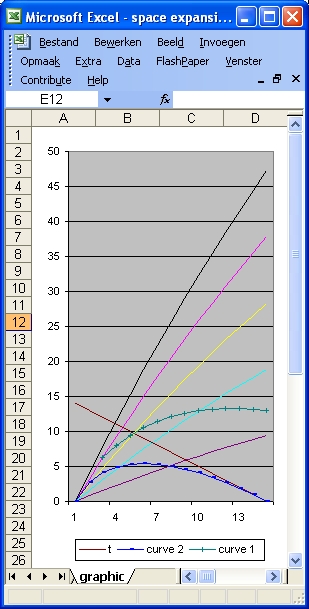
The table on the left consists of three columns.
- The left column shows the time since the Big Bang in increments of 1 billion lightyears.
- The middle column "H" shows space expansion in increments of 1 billion lightyears starting from the Big Bang
- The right column "H1" shows space expansion in increments of 100 million lightyears starting 1400 million years ago from present.
The right column shows a clearly linear relation for the first 1 billion years, as described by Hubble's Law.
The left column shows clearly that also for the function used in this example Hubble's Law is not valid in the first 5 billion years after the Big Bang.
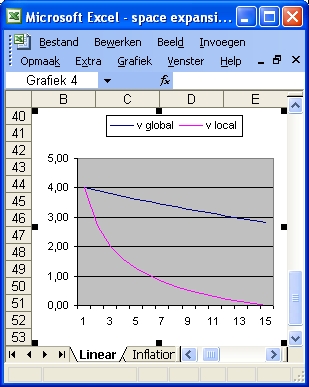
Figure 2 shows that the speeds involved near the 100% line are much larger than c, assuming that the Cosmological principle applies.
|
|