The last value in column 2 of simulation 1 is 533.91
The last value in column 2 of simulation 2 is 524.91
Simulation 3
The results of simulation 3 are shown in: Table 2, Simulation 3The starting date for simulation 3 is the same as simulation 1. The difference between simulation 1 and 3 are the following:
- The speed of the Sun in simulation 1 is 0 km/sec and in simulation 3 is 200 km/sec.
- The direction of movement of the Sun is 180 degrees (away from Aphelion and towards Perihelion).
- The speed of gravity propagation is 100 * c.
- General Relativity Theory is not used.
The reason of this difference can be:
- The speed and direction of the Sun is different.
- The speed of gravity propagation should be different and most probably be larger.
The last value of simulation 3 column 3 is 618.81.
This value represents the final averaged value after 420 revolutions when the Sun moves away from Aphelion. This is 93.40 more than the final value 525.41 of simulation 1 column 3.
That is the maximum case.
In the opposite case the Sun would move towards Aphelion. The result of a simulation under those conditions gives a final average value of 430.41 arc seconds. This is 95.00 less than the final value 525.41 of simulation 1 column 3.
That is the minimum case.
This means many other values are possible including 574 arc sec per century.
Reflection
The most important aspect of simulation 1 and 2 is to demonstrate that it is difficult to calculate the forward movement of Mercury based on observations. The angle depents very much about the starting date and final date. To do this accurate a much longer period than 100 years is required.
The final value in the third column of simulation 1 (525.61) and 2 (518.14) should both have been equal to 531 arc seconds per century.
In order to improve the simulation one method is to increase the number of planets. One can divide each planet in two parts, which each half the mass of the original planet. The second planet of each is placed 180 degrees forward.
The forward angle after 420 revolutions in simulation 1 is than 529.04 arc seconds.
The forward angle after 420 revolutions in simulation 2 is than 524.78 arc seconds.
The most important aspect of simulation 3 is to demonstrate that it is possible to simulate the movement of the planet Mercury without the Relativity Theory.
The most important assumption for this simulation is that the speed of gravity propagation is much larger than c.
For a more technical description see:The Reality, Now and Understanding
Planet 3D results
This paragraph shows the results of two simulations with the Visual Basic program "Planets3D".For more technical information goto: PLANET.TXT . This is a chapter from the above mentioned e-book. Specific goto chapter 3: Mercury and Venus. In this chapter the influence of venus on the movement on the planet Mercury is explained.
-
Mercury and Venus
The following picture shows the forward movement of the planet Mercury caused by the planet Venus.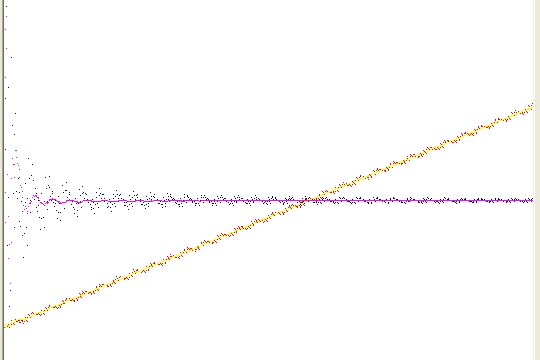
Picture 1A
A more or less horizontal part and a second part under an angle of 45 degrees.
Each part consists of two lines.
In the horizontal part this are the blue line (dots) and the pink line.
In the 45 degree part this are the red line (dots) and the yellow line.The simulation more or less starts the first time when Mercury reaches aphelion. (furtest distance). This defines angle 0.
The second time when Mercury reaches aphelion defines angle 1. The differences between angle 1 and angle 0 defines the first red dot (left bottom corner)
The third time when Mercury reaches aphelion defines angle 2. The differences between angle 2 and angle 0 defines the second red dot.
The fourth time when Mercury reaches aphelion defines angle 3. The differences between angle 3 and angle 0 defines the third red dot
This angle slowly increases, which explains the 45 angle.
The yellow line is more or less the same as the red line (dots), but now a more or less running averege is shown. (running squared distance).The red dots define an angle as a function of a running time. The blue line defines also an angle but the time period is fixed i.e. 100 years. That is why the line of 45 degrees and the horizontal line cross each other at a distance 100 years after the origin. In this case this angle is 276.8 arc secs.
The pink line defines again the running average.What is important to see that the forward movement angle is rather irregular. This is caused because the distance between Venus and Mercury is rather irregular. Specific the average distance during one revolution of Mercury depents very much on the average position of Venus. The influence is very different when Venus is on average closer to aphelion as to perihelion.
-
Mercury and 6 planets
The following picture shows the forward movement of the planet Mercury caused by the planets Venus, Earth, Mars, Jupiter, Uranus and Neptune.
Picture 1B
Feedback
None
Back to the: Contents of This Page
Table 1, Simulation 1 and 2
            simulation 1                   simulation 2

Rev    delta a      a      av(a)      delta a      a       av(a)
  0                0.0
  1    3363.86  3363.86  3363.90                  0.0
  2     335.95  1849.91  1849.92       313.81   313.81   313.81
  3    -399.63  1100.07  1140.94      -353.13   -19.66   -19.66
  4     246.71   886.73   875.03       325.99    95.56    57.83
  5    3302.44  1369.87  1103.13      3127.86   853.64   609.54
  6     921.91  1295.21  1170.31       783.60   839.63   775.86
  7    -670.02  1014.47  1077.78      -652.37   590.97   706.50
  8    -352.88   843.55   961.24      -251.47   470.62   612.89
  9    1408.51   906.32   921.29      1557.30   606.45   617.66
 10    -174.39   798.25   862.28      -290.78   506.76   581.62
 11    -995.27   635.21   774.75     -1040.94   351.99   505.47
 12   -1540.39   453.91   664.78     -1532.59   180.67   401.92
 13     689.70   472.04   595.69       833.82   235.10   349.09
 14    1678.91   558.25   570.49      1854.24   359.65   347.32
 15    -952.28   457.55   529.31      -981.19   263.87   321.90
 16   -1925.82   308.59   466.01     -1956.12   115.87   268.04
 17   -1323.82   212.56   398.53     -1342.39    24.73   207.66
 18    2108.92   317.92   369.25      2288.32   157.89   191.16
 19    4057.99   514.77   385.70      4020.93   372.50   222.85
 20   -1110.38   433.51   384.45     -1130.95   293.37   232.55
                                     -1316.09   212.90   225.56
400    -455.71   529.08   525.22
401    4298.61   538.48   525.35      4189.17   531.65   518.51
402    1635.48   541.21   525.51      1509.01   534.09   518.69
403    -936.71   537.54   525.62      -919.47   530.47   518.82
404   -1116.90   533.45   525.70     -1074.88   526.49   518.91
405     280.97   532.82   525.77       361.21   526.08   519.00
406     802.11   533.49   525.85       676.16   526.45   519.09
407    -716.81   530.42   525.89      -792.41   523.20   519.14
408   -1223.36   526.12   525.89     -1233.10   518.89   519.16
409    -108.37   524.57   525.88       -19.80   517.57   519.16
410     534.19   524.59   525.87       665.62   517.93   519.16
411    -747.67   521.49   525.82      -823.88   514.65   519.14
412    -678.07   518.58   525.75      -734.71   511.61   519.08
413    -924.61   515.09   525.65      -922.09   508.14   518.99
414    1133.07   516.58   525.56      1259.47   509.95   518.92
415    3121.89   522.86   525.54      3221.45   516.50   518.91
416     192.21   522.06   525.50       159.27   515.64   518.89
417    -994.19   518.43   525.43     -1006.54   511.98   518.84
418    -477.60   516.04   525.34      -483.63   509.60   518.77
419    3797.18   523.88   525.33      3896.40   517.70   518.77
420    4737.21   533.91   525.41      4652.45   527.57   518.87
421                                   -587.89   524.91   518.95
Back to the: Contents of This Page
Table 2, Simulation 3
         simulation 3

Rev   delta a      a      av(a)
  0               0.0
  1   3457.32  3457.32  3457.37
  2    429.40  1943.37  1943.39
  3   -306.16  1193.53  1234.40
  4    339.90   980.12   968.45
  5   3396.18  1463.34  1196.57
  6   1015.40  1388.68  1263.76
  7   -576.55  1107.94  1171.24
  8   -259.68   936.98  1054.69
  9   1501.04   999.66  1014.70
 10    -80.86   891.61   955.67
 11   -901.26   728.62   868.14
 12  -1447.17   547.31   758.18
 13    782.03   565.36   689.06
 14   1771.24   651.50   663.83
 15   -858.26   550.84   622.63
 16  -1831.73   401.94   559.34
 17  -1231.14   305.87   491.85
 18   2201.43   411.18   462.56
 19   4151.59   608.05   479.00
 20  -1016.87   526.80   477.75

400   -332.07   622.59   618.62
401   4353.64   631.89   618.75
402   1666.33   634.46   618.91
403   -847.61   630.79   619.02
404   -982.80   626.79   619.10
405    405.54   626.24   619.17
406    828.59   626.74   619.24
407   -657.66   623.59   619.28
408  -1093.57   619.38   619.28
409     -4.46   617.85   619.27
410    691.65   618.03   619.26
411   -686.27   614.86   619.22
412   -587.09   611.94   619.14
413   -862.82   608.37   619.04
414   1298.98   610.04   618.95
415   3263.51   616.43   618.93
416    271.05   615.60   618.90
417   -937.53   611.88   618.83
418   -369.65   609.53   618.74
419   3947.11   617.50   618.73
420   4764.98   627.37   618.81
Back to the: Contents of This Page
Created: 31 August 1996
Modified: 10 Mai 2002
Updated: 14 October 2015
Back to my home page: Contents of This Document