Feeling the Future: Experimental Evidence for
Anomalous Retroactive Influences on Cognition and Affect

Purpose

The purpose of this document is twofold:
  1. To discuss three documents about ESP or psi
  2. To test your owm ESP capabilities. To do that goto ESP experiment
This document discusses the following three articles:
  1. "Feeling the Future: Experimental Evidence for Anomalous Retroactive Influences on Cognition and Affect" by Daryl J. Bem Cornell University. For a copy of the article select: FeelingFuture.pdf
  2. The Precognitive habituation effect: An adaptation using spider stimuli. By: Louie Savva, Robert Child & Matthew D. Smith
    Parapsychology Research Group, Department of Psychology Liverpool Hope University College
    For a copy of the article select: 19.pdf or 19.pdf
  3. "Response to Alcock’s “Back from the Future: Comments on Bem" by Daryl J.Bem Cornell University. For a copy of the article select: ResponsetoAlcock.pdf

Article 1

The article starts with the text:
The term psi denotes anomalous processes of information or energy transfer that are currently unexplained in terms of known physical or biological mechanisms.
This aspect of the document will not be discussed.
In the article we read:
This article reports 9 experiments, involving more than 1,000 participants
Only the mathematical interpretations of experiment 1 will be discussed.


Experiment 1 Precognitive Detection of Erotic Stimuli

At page 6 we read:
One hundred Cornell undergraduates, 50 women and 50 men, were recruited for this experiment using the Psychology Department’s automated online sign-up system
Next at page 7:
There will be 36 trials in all.
Next at page 7:
For this purpose, 40 of the sessions comprised 12 trials using erotic pictures, 12 trials using negative pictures, and 12 trials using neutral pictures. The sequencing of the pictures and their left/right positions were randomly determined by the programming language’s internal random function. The remaining 60 sessions comprised 18 trials using erotic pictures and 18 trials using nonerotic pictures.
Next at page 7:
There will be 36 trials in all.

Results and Discussion

Across all 100 sessions, participants correctly identified the future position of the erotic pictures significantly more frequently than the 50% hit rate expected by chance: 53.1%, t(99) = 2.51, p = .01, d = 0.25.3 In contrast, their hit rate on the nonerotic pictures did not differ significantly from chance: 49.8%, t(99) = -0.15, p = .56. This was true across all types of nonerotic pictures: neutral pictures, 49.6%; negative pictures, 51.3%; positive pictures, 49.4%; and romantic but nonerotic pictures, 50.2%. (All t values < 1.)
A hit rate of 50% is only expected (with high confidance) for very large numbers involved. See also reflection part 1.


Article 2

The reason to discuss this article because it is mentioned at page 35 of article 1.
In article 2 at page 226 is written (slightly adapted):
There were 12 spider trials and a further 36 low-affect trials.
The hit rate for the overall study is 51.3% for the spider pictures and is not significantly above chance (50 participants) and 48.1% for the low-affect stimuli (50 participants). This splits across the fear groups where the spider fear group obtained a hit rate of 54% on the spider stimuli (25 participants) and a 48% hit rate on the low-affect pictures (25 participants). The no fear group obtained a hit rate of 49% on the spider pictures (25 participants) and 48% on the low-affect pictures (25 participants). As such the hit rate is in the predicted direction but is not significantly different from mean chance expectation.
Etc Etc.
This suggests that for the spider-fear group performance on the PH task seems to be significantly different when the stimuli are spider related than when the stimuli are low-affect


Random Number Generator

In order to evaluate both articles an Excel Program is used. This program examinates the results of both articles using a Random Number Generator.
In article 1 at page 11 starting at the middle is written:
Such random functions are sometimes called pseudo random number generators (PRNGs) because they use a mathematical algorithm to generate each subsequent number from the previous number, and the sequence of numbers is random only in the sense that it satisfies (or should satisfy) certain mathematical tests of randomness. It is not random in the sense of being indeterminate because once the initial starting number (the seed) is set, all future numbers in the sequence are fully determined. In contrast, a hardware-based or “true” RNG is based on a physical process, such as radioactive decay or diode noise, and the sequence of numbers is indeterminate in the quantum mechanical sense. This does not in itself guarantee that the resulting sequence of numbers can pass all the mathematical tests of randomness
The RNG used in the Excel programme is a combination between a PRNG and a physical process. The physical process is the Timer function within Excel. For a copy of the program RndTest.xls select: RndTest.zip

Operation RndTest.xls

The Excel program (blad simulation) depents of four parameters:
1: # of Participants, 2: # of Questions, 3: # of Tests and 4: # of answers
  1. The parameter # of Participants. This parameter identifies the number of people that are participating in a certain test or subtest. It is important to understand that a test can involve a subtest. For example you can test for animals. A subtest could be to test on sheeps and dogs.
  2. The parameter # of Questions This parameter identifies the number of questions that are related to a subtest.
  3. The parameter # of Test Sessions A test session can be for example to ask 30 participants 20 questions related to animals. This parameter idintifies how often you want to repeat this question.
  4. The parameter # of answers. This parameter identifies how many selections or answers are possible. If the selections are only left or right than the "# of answers" parameter is 2.
In order to start the programme the "Start" button is used.
At the End of the programme the top three lines show the results of the last session.
The page "Data" shows the answers of the last session for each participant.

RndTest.xls

In order to test the programme the information at page 14 is used:
Accordingly, I ran three experiments that simulated the experiment just reported, etc
Each experiment comprised 100 sessions of 36 trials per session in which the same PRNG or RNG provided both the left/right response of a virtual participant and the subsequent left/right position of the target. These control experiments all yielded null results: The hit rates were 49.5% , 50.4%, and 49.5% respectively.
At the end of the programme the simulation shows the following display:
Test 1: 100 participants and 36 trials using neutral pictures.
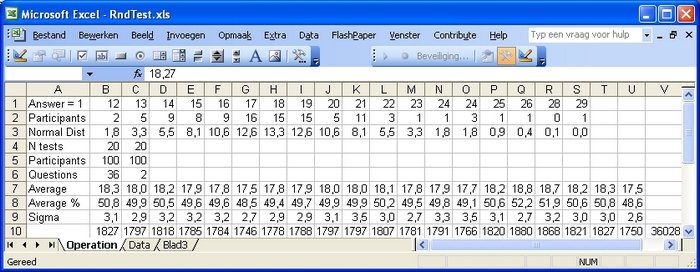

Evaluation Simulation article 2

Article 2 Spider test, contains 6 tests or subtests:
  1. 50 participants and 12 spider trials. Average 51.3%
  2. 50 participants and 36 low effect trials. Average 48.1%
  3. 25 participants with fear and 12 spider trials. Average 54%
  4. 25 participants no fear and 12 spider trials. Average 49%
  5. 25 participants with fear and 36 low effect trials. Average 48%
  6. 25 participants no fear and 36 low effect trials. Average 48%
For the results of the test/subtests of article 2 see:Article 2 Simulation Spider Test
Accordingly to article 1 page 35:
The spider-phobic participants had a hit rate significantly above chance on the spider trials, 53.7%,
The results of the simulation of test 3 show that 53.7% is not exceptional.


Evaluation Simulation article 1

Article 1 contains 6 tests or subtests:
  1. 40 participants and 12 trials using erotic pictures. 53.1%
  2. 40 participants and 12 trials using negative pictures. 51.3%
  3. 40 participants and 12 trials using neutral pictures. 49.6%
  4. 60 participants and 18 trials using erotic pictures. 53.1%
  5. 60 participants and 18 trials using non erotic pictures. 49.4%
For the results of the test/subtests of article 2 see:Article 1 Results Erotic Test
The overall hit rate of erotic pictures is 53.1%. Accordingly to the results of the simulations (the subtests 1 and 4) this is not exceptional.


Reflection part 1

The experiments try to show that it is possible by participants to "predict" the outcome of selection tests with only two possibilities: True or false. True meaning that the participant shows the frame which contains a picture.

The results of the simulations show that the results of the experiments is not exceptional i.e. as expected based on chance.

In experiment 1 the preference between 3 types of pictures is tested. What is strange why does someone expect that the partipant is capable to select certain of those pictures more accurate than the others even when he or she does not know which of the types he or she is actual testing. ?

What is strange that the two articles try to demonstrate this capability for the whole population. (In some cases the population is divided in man and woman). I would done this differently. What I would have done is to divide the experiment in two stages. In the first stage I would show 100 participants 50 erotic pictures. The participant with the highest score would perform stage 2. In stage 2 I would show this participant 200 erotic pictures and see how he or she performed.


Reflection Article 3

At page 3 of article 3 is written:
Across all nine experiments, the combined odds against the findings being due to chance are greater than 70 billion to 1.
The problem with some experiments is that it is difficult to establish how many participants are involved. The problem with almost experiments is that is very difficult to decide how many identical questions are asked i.e. the same pictures are shown. That means almost all experiments are difficult to simulate.
A typical case is the text of page 8 of article 1 :
Although it is always desirable to have as many trials as possible in an experiment, there are practical constraints limiting the number of critical trials that can be included in this and several others experiments reported in this article. In particular, on all the experiments using highly arousing erotic or negative stimuli a relatively large number of nonarousing trials must be included to permit the participant’s arousal level to “settle down” between critical trials. This requires including many trials that do not contribute directly to the effect being tested.
As I said above why are the experiments not as simple as possible: Show all 100 participants 20 highly arousing erotic pictures (If that is really what you want to test) and see how the participants respond.
At page 6 of article 3 is written:
By convention, psychologists are permitted to call a result “statistically significant” if it could have arisen by chance less than 5% of the time. This particular result could have occurred by chance less than 1% of the time.
If you consider article 2 than the results are all within this 5% range.
IMO the results of experiment 1 of article 1 are also all within this 5% range.


Feedback

None


Created: 4 April 2011

If you want to know more about Random Number Generators go to here: Random Numbers and Random Number Generators
Back to my home page Contents of This Document